Folium ist eine Python-Bibliothek zum Erstellen von interaktiven Karten. Die geplotteten Marker oder Polygone können mit folium.FeatureGroup() einzelnen Ebenen zugeordnet werden, die mit einem Mausklick an- und ausgeschaltet werden können.
Alle Beispiele, die ich im Netz gefunden habe, definieren jede einzelne Ebene explizit mit einem Befehl wie:
feature_group1 = FeatureGroup(name='Foo')
Wenn ich kategorische Daten in einem Geopandas.GeoDataFrame habe, dann möchte ich sicher nicht per Hand für jede Kategorie eine Ebene erstellen. Zum Glück können wir das automatisieren, indem wir jede initialisierte FeatureGroup einfach an eine Liste anhängen. Hier ein Beispiel mit Vulkanen.
Ein kurzer Blick auf die Daten:
volcanoes.info()RangeIndex: 1233 entries, 0 to 1232 Data columns (total 13 columns): # Column Non-Null Count Dtype --- ------ -------------- ----- 0 number 1233 non-null int64 1 name 1233 non-null object 2 country 1233 non-null object 3 vtype 1233 non-null object 4 evidence 1233 non-null object 5 last_eruption 1233 non-null object 6 region 1233 non-null object 7 subregion 1233 non-null object 8 elevation 1233 non-null int64 9 rocks 1198 non-null object 10 tectonic_setting 1230 non-null object 11 last_eruption_int 787 non-null float64 12 geometry 1233 non-null geometry dtypes: float64(1), geometry(1), int64(2), object(9) memory usage: 125.4+ KB
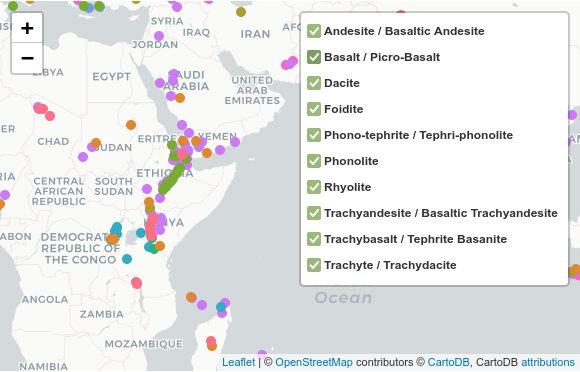
Ich möchte nun eine Karte, die nach Gesteinstyp gruppiert ist.
grouped = volcanoes.groupby('rocks')
Da die Farbpaletten von Seaborn besonders schön sind, erzeuge ich damit eine Liste mit Farben im HTML-Hex-Format. Die Anzahl der benötigten Farben ist len(grouped).
import seaborn as sns
pal = sns.color_palette("husl", len(grouped)).as_hex()
Da ich in diesem Beispiel nicht möchte, dass auch die Basiskarte (das Tilelayer) im LayerControl angezeigt wird, initialisiere ich die Karte ohne tiles und füge ein TileLayer mit control=False hinzu:
m = folium.Map(tiles=None)
folium.TileLayer('cartodbpositron', control=False).add_to(m)
Nun iterieren wir durch den gruppierten GeoDataFrame. Für jede Kategorie wird eine FeatureGroup erzeugt, die an eine Liste angehängt wird. Dann werden Marker für entsprechende Vulkane der zuletzt initialisierten FeatureGroup hinzugefügt.
f_groups = []

for group_name, group_data in grouped:
    f_groups.append(folium.FeatureGroup(group_name))
    color = pal.pop()

    for i in range(0,len(group_data)):

        # html for popup of markers
        html=f"""
            <h2>  {group_data.iloc[i]['name']} </h2>
            <small>
            <p> Country: {group_data.iloc[i]['country']}  <br/>
            Elevation: {group_data.iloc[i]['elevation']}  <br/>
            Last Eruption:
            {group_data.iloc[i]['last_eruption']}  <br/>
            Rocks: {group_data.iloc[i]['rocks']}  <br/>
            Tectonic Setting:
            {group_data.iloc[i]['tectonic_setting']}  </p>
            </small>
            """

        iframe = folium.IFrame(html=html, width=300, height=200)
        popup = folium.Popup(iframe, max_width=650)

        # Add markers to last FeatureGroup
        folium.CircleMarker(
            location=[group_data.iloc[i].geometry.y,
                      group_data.iloc[i].geometry.x],
            radius=5,
            popup=popup,
            tooltip=group_data.iloc[i]['name'],
            fill_color=color,
            stroke = False,
            fill_opacity = 1,
        ).add_to(f_groups[-1])

    # Add last featureGroup to Map
    f_groups[-1].add_to(m)

folium.LayerControl().add_to(m)

m