Folium is a Python library for creating interactive maps. The plotted markers or polygons can be assigned to individual layers (using folium.FeatureGroup()), which can be switched on and off with a mouse click.
All the examples I found on the net explicitly define each individual layer with a command like:
feature_group1 = FeatureGroup(name='Foo')
If I have categorical data in a Geopandas.GeoDataFrame, I certainly don’t want to create a layer for each category by hand. Fortunately, we can automate this by simply appending each initialised FeatureGroup to a list. Here’s an example with volcanoes.
A quick look at the data:
volcanoes.info()RangeIndex: 1233 entries, 0 to 1232 Data columns (total 13 columns): # Column Non-Null Count Dtype --- ------ -------------- ----- 0 number 1233 non-null int64 1 name 1233 non-null object 2 country 1233 non-null object 3 vtype 1233 non-null object 4 evidence 1233 non-null object 5 last_eruption 1233 non-null object 6 region 1233 non-null object 7 subregion 1233 non-null object 8 elevation 1233 non-null int64 9 rocks 1198 non-null object 10 tectonic_setting 1230 non-null object 11 last_eruption_int 787 non-null float64 12 geometry 1233 non-null geometry dtypes: float64(1), geometry(1), int64(2), object(9) memory usage: 125.4+ KB
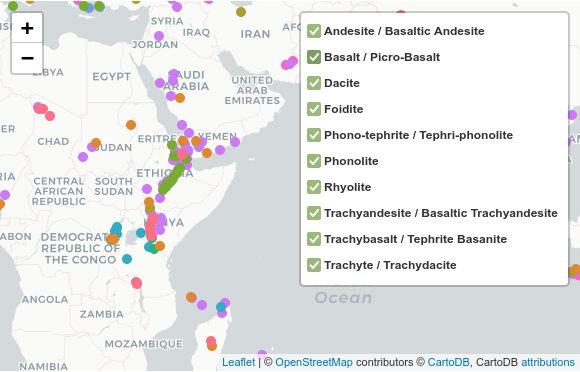
I want a map grouped by rock type.
grouped = volcanoes.groupby('rocks')
Since Seaborn’s colour palettes are particularly nice, I use them to create a list of colours in hex format (as used by html). The number of colours needed is len(grouped).
import seaborn as sns
pal = sns.color_palette("husl", len(grouped)).as_hex()
In this example I do not want the base map (the tile layer) to be displayed in the LayerControl as well. Therefore I initialise the map without tiles and add a TileLayer with control=False:
m = folium.Map(tiles=None)
folium.TileLayer('cartodbpositron', control=False).add_to(m)
Now we iterate through the grouped GeoDataFrame. For each category a FeatureGroup is created, which is appended to the list f_groups. Then markers for corresponding volcanoes are added to the last initialised FeatureGroup.
f_groups = []

for group_name, group_data in grouped:
    f_groups.append(folium.FeatureGroup(group_name))
    color = pal.pop()

    for i in range(0,len(group_data)):

        # html for popup of markers
        html=f"""
            <h2>  {group_data.iloc[i]['name']} </h2>
            <small>
            <p> Country: {group_data.iloc[i]['country']}  <br/>
            Elevation: {group_data.iloc[i]['elevation']}  <br/>
            Last Eruption:
            {group_data.iloc[i]['last_eruption']}  <br/>
            Rocks: {group_data.iloc[i]['rocks']}  <br/>
            Tectonic Setting:
            {group_data.iloc[i]['tectonic_setting']}  </p>
            </small>
            """

        iframe = folium.IFrame(html=html, width=300, height=200)
        popup = folium.Popup(iframe, max_width=650)

        # Add markers to last FeatureGroup
        folium.CircleMarker(
            location=[group_data.iloc[i].geometry.y,
                      group_data.iloc[i].geometry.x],
            radius=5,
            popup=popup,
            tooltip=group_data.iloc[i]['name'],
            fill_color=color,
            stroke = False,
            fill_opacity = 1,
        ).add_to(f_groups[-1])

    # Add last featureGroup to Map
    f_groups[-1].add_to(m)

folium.LayerControl().add_to(m)

m